Understanding the Benefits Engagement report
Who should read this?
Anyone who uses League’s Digital Success Portal.
The Benefits Engagement report gives you insight into how employees use their League Wallet and spending accounts. This data can help you understand what benefits employees are engaging with the most and what types of spending account claims they’re spending the most money on.
Example
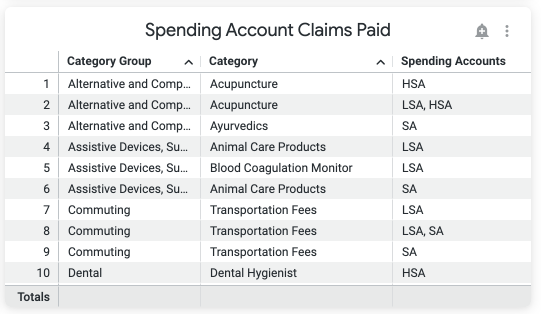
Imagine you want to understand what types of spending account claims employees are submitting the most. You check the Spending Account Claims Paid data in the Benefits Engagement report and see employees are submitting a lot of claims for chiropractic expenses. You decide to look into adding paramedical benefits to your benefits plan, to help employees pay for these types of expenses.
Keep reading to understand:
What data you’ll find
You can find the following data in the Benefits Engagement report:
Data Point | Description |
Unique Users Viewed Wallet | The number of users who viewed a benefit in their Wallet this quarter. |
Number of Wallet Card Views | The number of benefits that employees viewed in the Wallet this quarter. |
Unique Users with Approved Spending Account Claims | The number of employees we approved spending account claims for this quarter. |
Wallet Card Views | A chart showing the number of employees who viewed a benefit in their Wallet this quarter and the number of benefits they viewed in the Wallet, broken down by benefit type. |
Spending Account Claims Paid | A table showing the: Category and Category Group: The types of claims reimbursed for employees for the quarter. Spending Accounts: What spending accounts employees were reimbursed from for each category. Total Claims Paid: The number of claims reimbursed for employees for each category. Total Claim Amount Paid: The dollar amount reimbursed for employees for each category. Totals: The total number of claims and dollar amount reimbursed for employees across all categories. You can find these totals at the bottom of the table. |
Tip: Hover over the information icon to learn more about each data point.
Example View


Need help understanding the data?
We’re happy to help! Create a Case or schedule a call with a Customer Success Manager through the Digital Success Portal.
.png)