Understand the Onboarding & Demographics report
Who should read this?
Anyone who uses League’s Digital Success Portal.
The Onboarding & Demographics report gives you high-level insight into how employees engage with League. This report shows you how many employees have created League accounts, how they’re engaging with the platform, as well as demographic information about those employees.
Example
Imagine you want to understand whether employees are engaging with League. You can check the Monthly Active Users (MAU) data on the Onboarding & Demographics report and see that out of employees with a League account, a high percentage of them use League regularly. But when you look at the Activation data, a low percentage of employees have created a League account.
This data helps you realize that employees who create a League account like the platform and use it a lot, so you then you can create a new case with type set to “Meeting Request” to talk about how to encourage more employees to create League accounts.
Keep reading to understand:
What data you’ll find
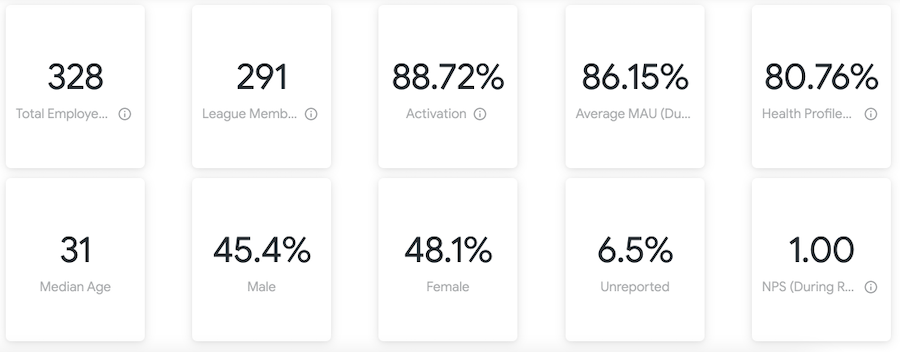
You can find the following data in the Onboarding & Demographics report:
Data Point | Description |
Total Employees | The total number of employees with an “Invited” status (we invited them to join League but they haven’t created an account yet) or an “Active” status (they have a League account). |
League Members | The number of employees with a League account. |
Activation | The percentage of employees who activated (created) their League account. |
Average Monthly Active Users (MAU) | The average percentage of employees who used League at least once each month this quarter. |
Health Profile Completion | The percentage of employees who completed the Health Profile assessment. |
Median Age | The mid-range age of employees. |
Demographics by Sex | The percentage of employees who picked female, male or unreported as their sex. |
Net Promoter Score (NPS) | The total NPS score, calculated from the NPS surveys employees submitted this quarter. |
Tip: Hover over the information icon to learn more about each data point.
Example View
Need help understanding the data?
We’re happy to help! Create a Case or schedule a call with a Customer Success Manager (CSM) through the Digital Success Portal.